






Commit 50 tons. Deliver 35. Leaving money on the table.
This is the moment commercial growers know too well. The operation is running fine, but your forecast missed reality. The true cost isn't just lost volume, it's damaged buyer relationships, wasted Friday labour, and logistics booked against numbers that didn't hold.
Let's fix your forecast together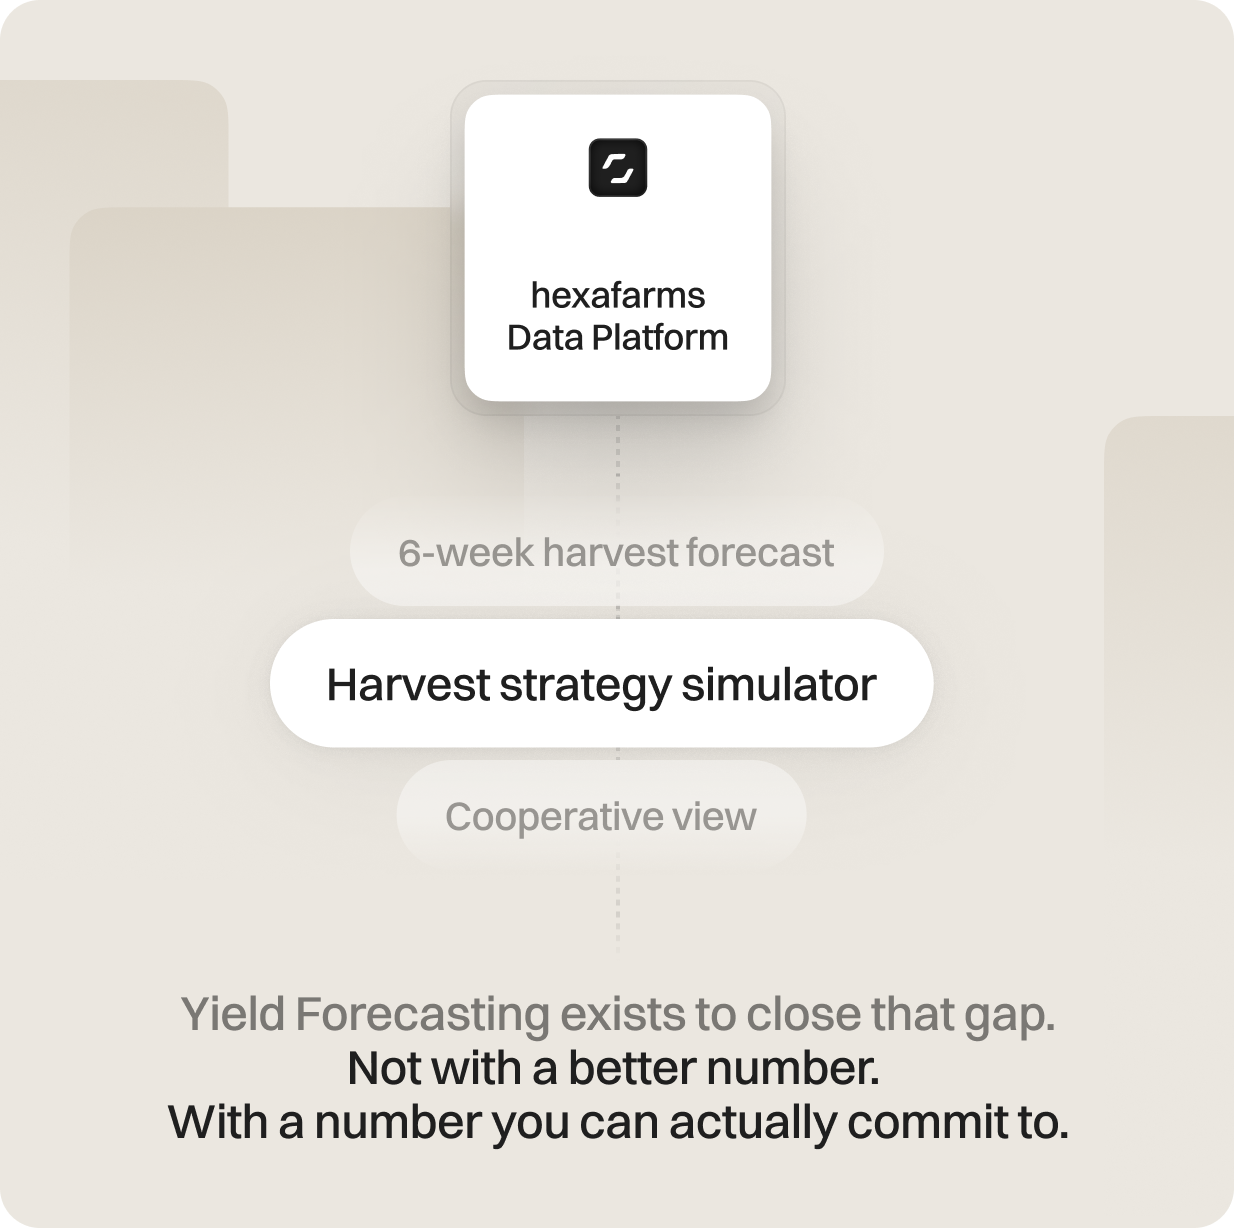
Available for these crops:

Three ways to predict what your harvest will deliver
The question is not whether to forecast, it is whether your forecast is tight enough to actually commit to a buyer. That depends entirely on how it is built.
Spreadsheets and grower's intuition
Weekly estimates from experienced growers combined into a single number for the sales team. Fast to run, with no setup cost, and often accurate when one experienced grower manages the same variety year after year. The challenge comes when that grower leaves, the variety changes, or changes need to be made dynamically.
Works well if:
- Volume is small and forecast misses are affordable.
- One senior grower with long variety history is always available.
- You are not supplying supermarkets on weekly volume contracts.
Standalone forecasting platforms
Dedicated forecasting tools connected to your climate computer via API. More structured than spreadsheets, but most still rely on industry-average yield curves. They know the weather, not your plants. If anything changes, you only find out once it is already too late.
Works well if:
- Close enough is good enough for your buyer commitments.
- Your operation is standard enough that industry averages hold.
- You do not need sensing or pest detection integrated.
hexafarms Yield Forecasting
Part of the hexafarms OS, built on the way you operate.
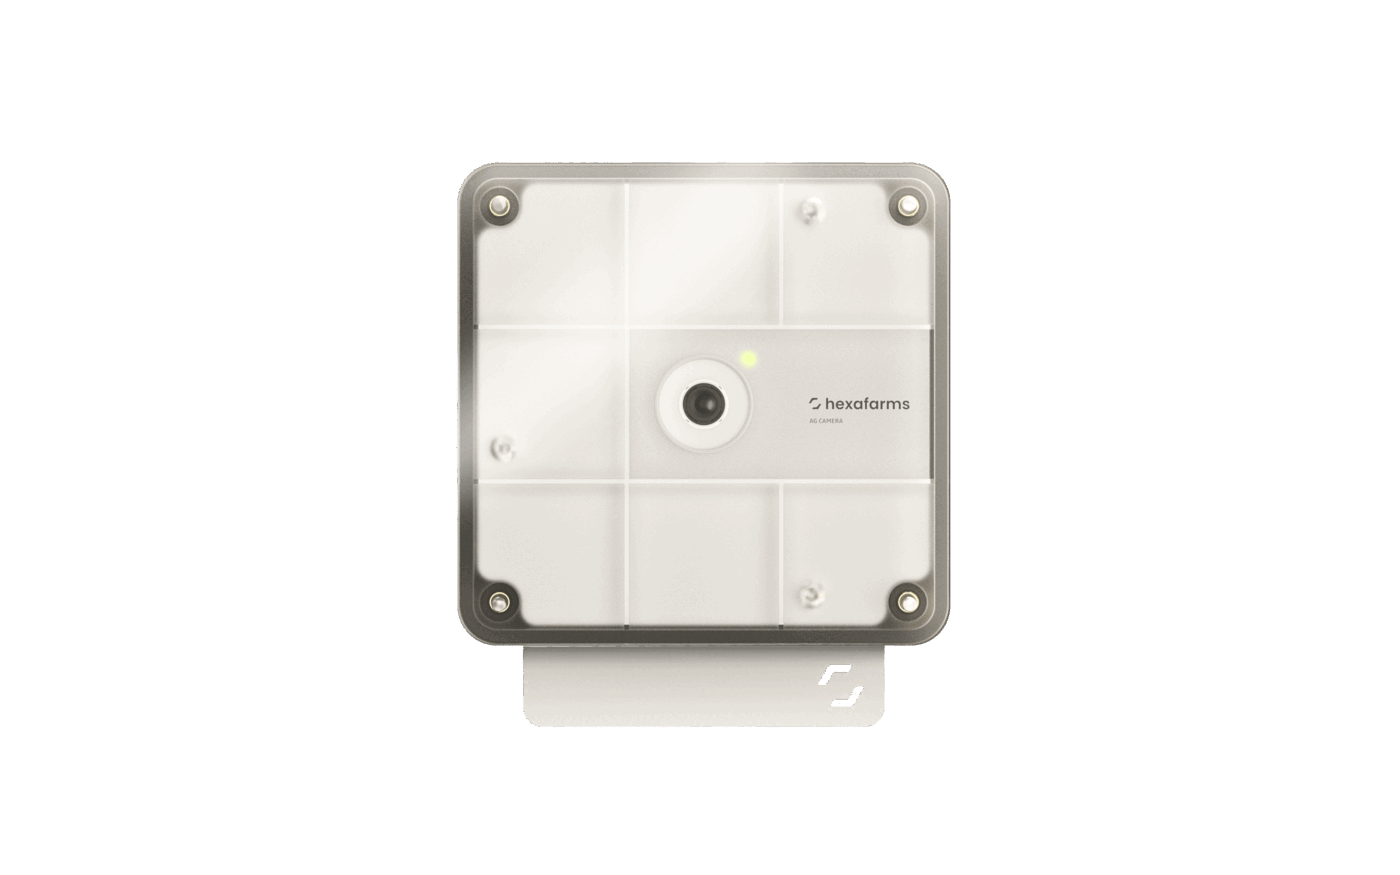
Trained on your plants, variety, and growing history, not industry averages. Using hardware installed in your operation we look at your plants the same way you do. You can see every building block that makes up the forecast and how reliable it is. Up to 30% lower variance than yield-curve methods, giving you forecasts you can confidently commit to.
Works well if:
- You supply supermarkets on weekly volume contracts.
- Labour planning, logistics, and pricing depend on forecast precision.
- You want a forecast that gets more accurate as time goes on.
Accurate early. Keeps improving as your data builds.
Want to see what this looks like for your crop?
Speak to our teamWhy traditional forecasts keep missing
Every operation is different
Yield-curve based tools work well in standard operations with consistent varieties. The pain shows up when circumstances change, new varieties, unusual seasons, a climate that continues changing.
They look at averages, not your operation
Industry yield curves are built on historical averages across many operations. Your operation is not average. Your variety, your substrate, your microclimate, your management decisions, none of these are captured in a generic curve.
They measure climate, not plants
GDD knows what the thermometer said. It doesn't not know how many flowers set this week, whether fruit is colouring on schedule, or whether the vegetative-generative balance shifted after last week's heat wave.
They report a number, not how they got there
A forecast is built on trust, if a grower can't see what factors are making up their forecast it will not be used. It is a guess with a decimal point. If you don't know how much you can trust your forecast you still cannot commit to a buyer.
Why accuracy alone is not enough
Most forecasting vendors report a 90%+ average accuracy. But averages hide a dangerous truth.
A forecast that is 100% accurate one week and 0% the next still averages out to 50%.
You don't need a single blind guess. You need a forecast that tells you how it was built so that you can commit with confidence.
A mean accuracy figure tells you absolutely nothing about weekly performance and real-world unpredictability.
The mean looks fine on paper, but the variance completely destroys your ability to commit to buyers or plan labor.
This is why hexafarms reports every factor that goes into your forecast and what impact it has. This allows you to steer your crop in the way you want and see the impact on your bottom line in real time.
Three features. One complete picture of your harvest.
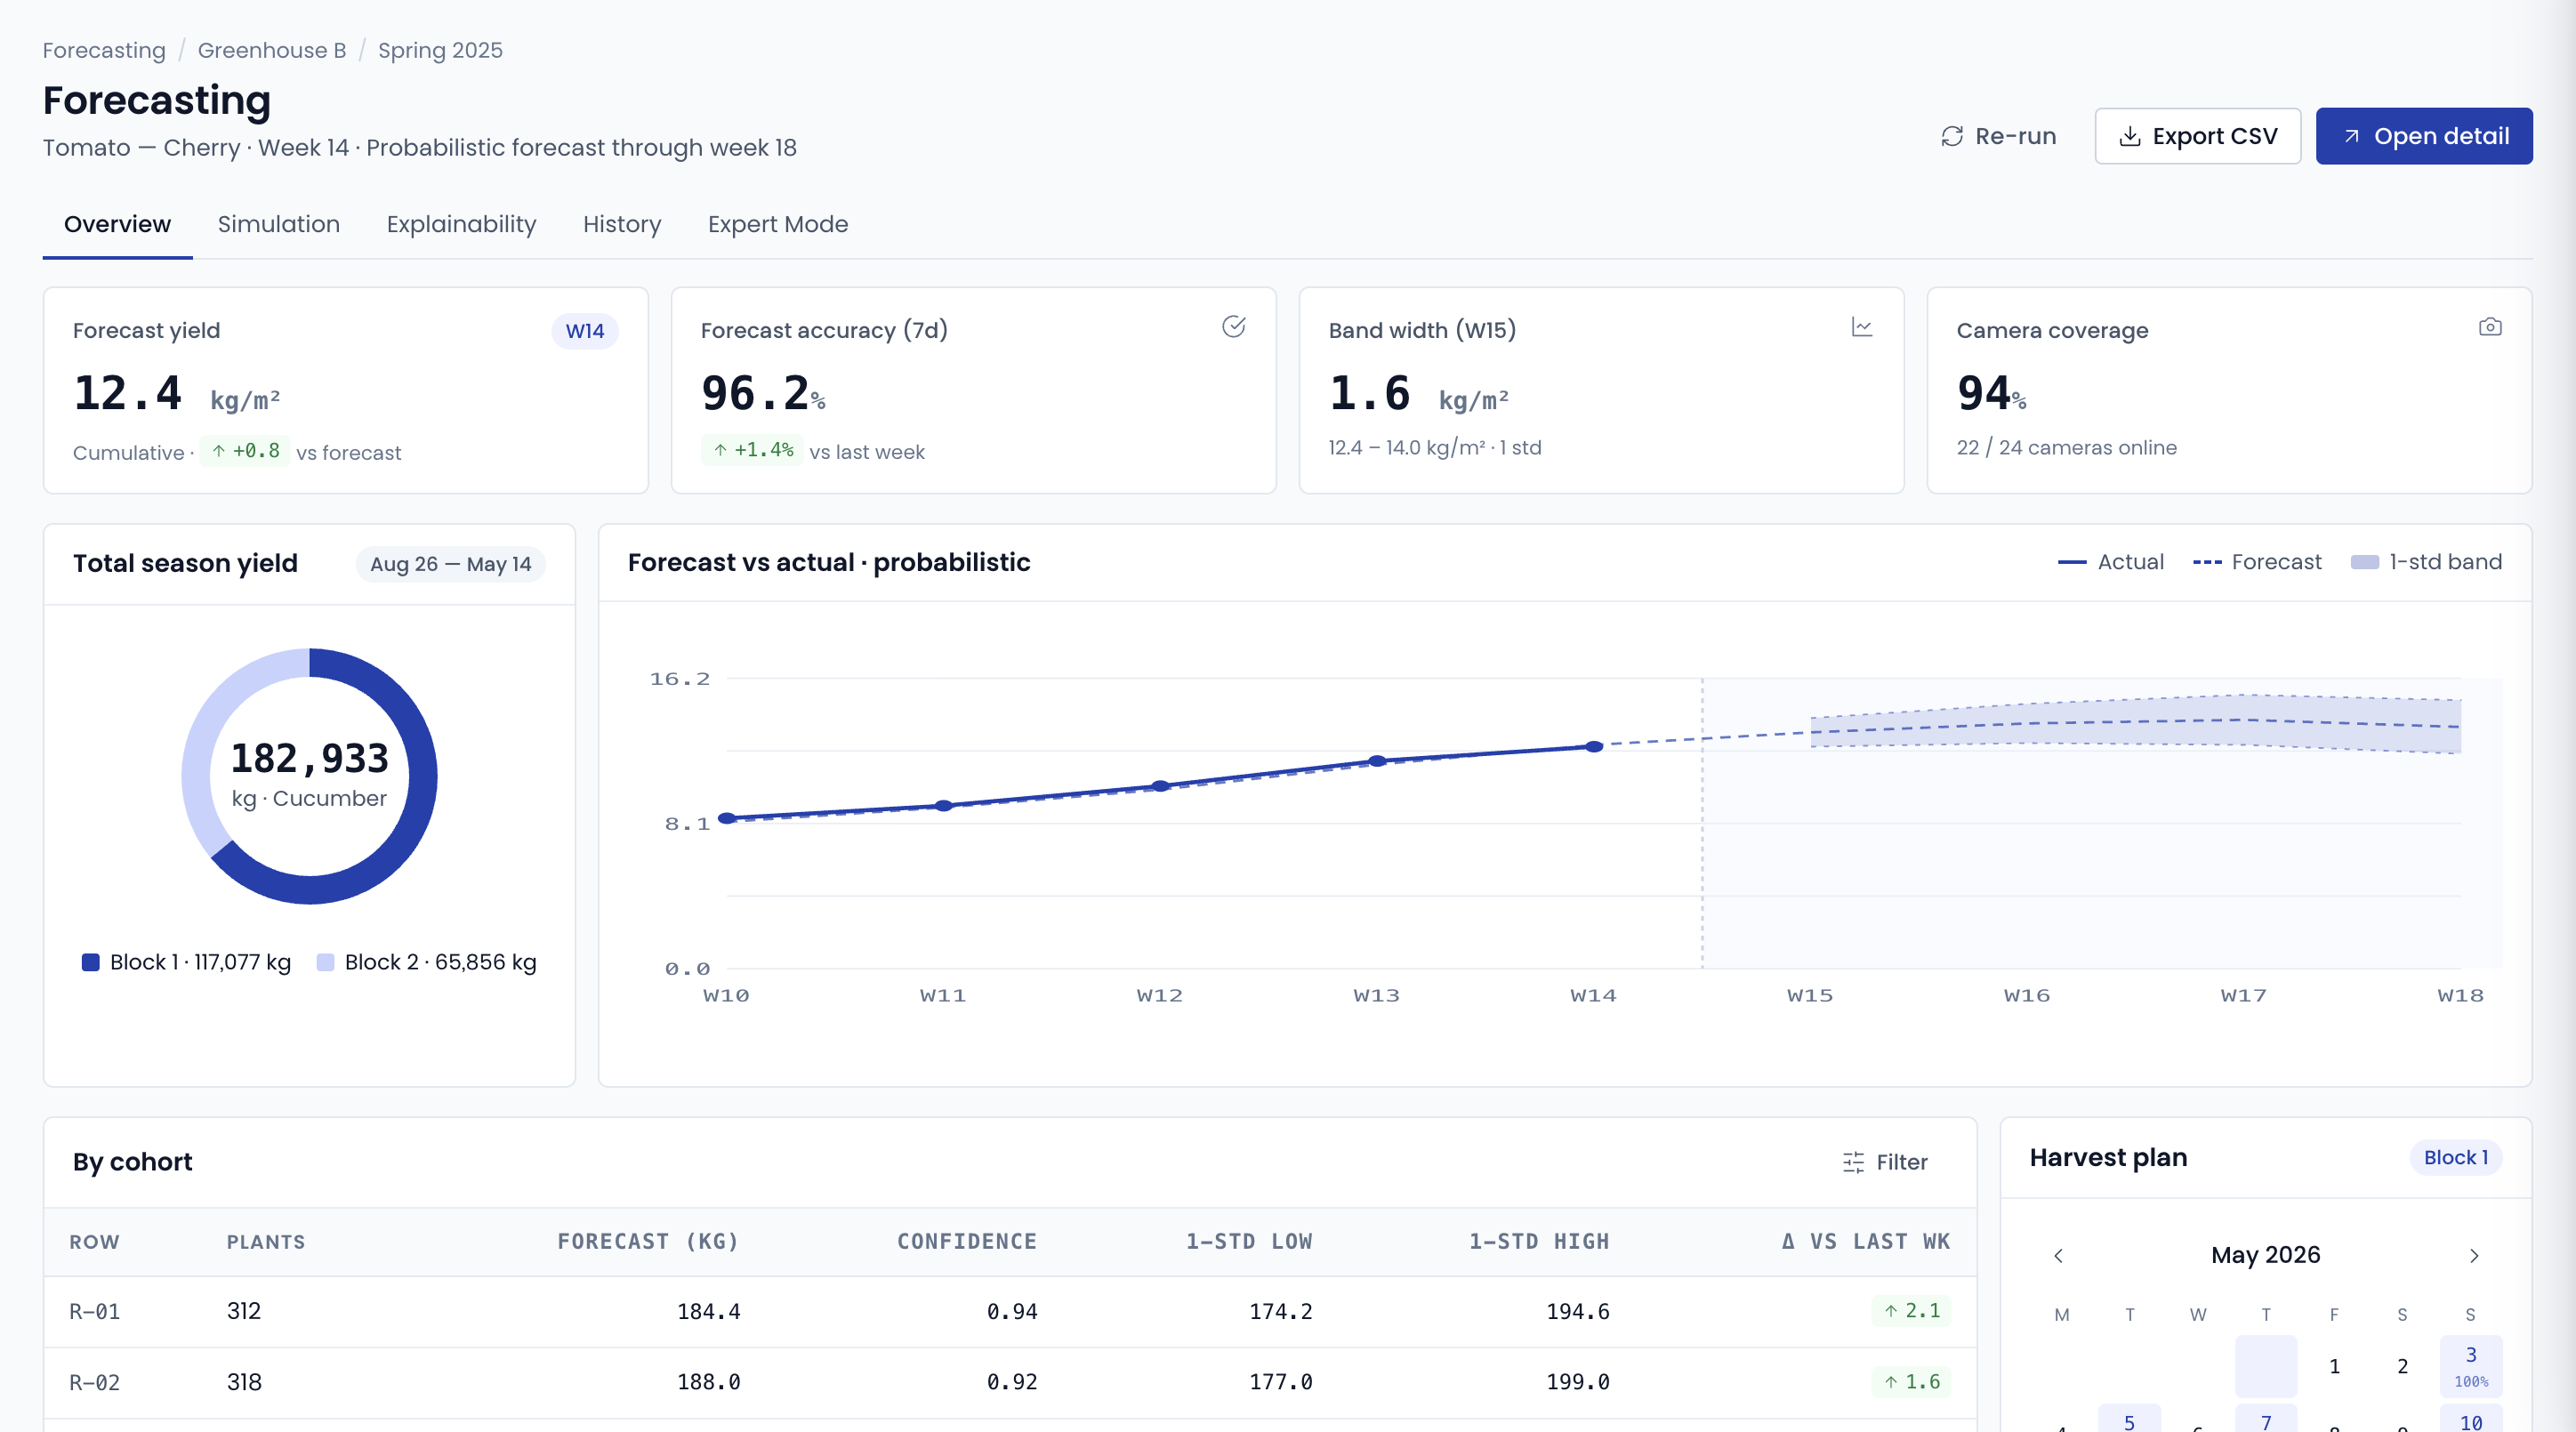
4-Week Yield Forecast
A rolling prediction of yield for the next four weeks, per crop and per department. Updated every time new sensor data or fruit counts come in. Reported with confidence intervals, never as a single number.
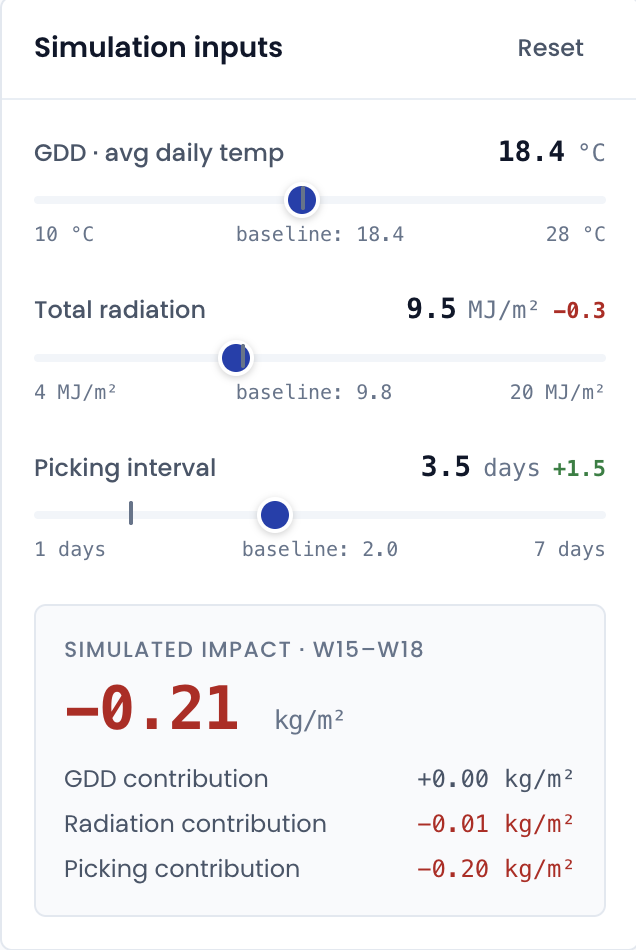
Harvest Strategy Simulator
Three levers you can pull to see how harvest volume and timing shift in real time: Harvest Cadence, Harvest Percentage, and Ripeness Stage. The simulation allows you to see exactly how much you will harvest if you change your harvest strategy.
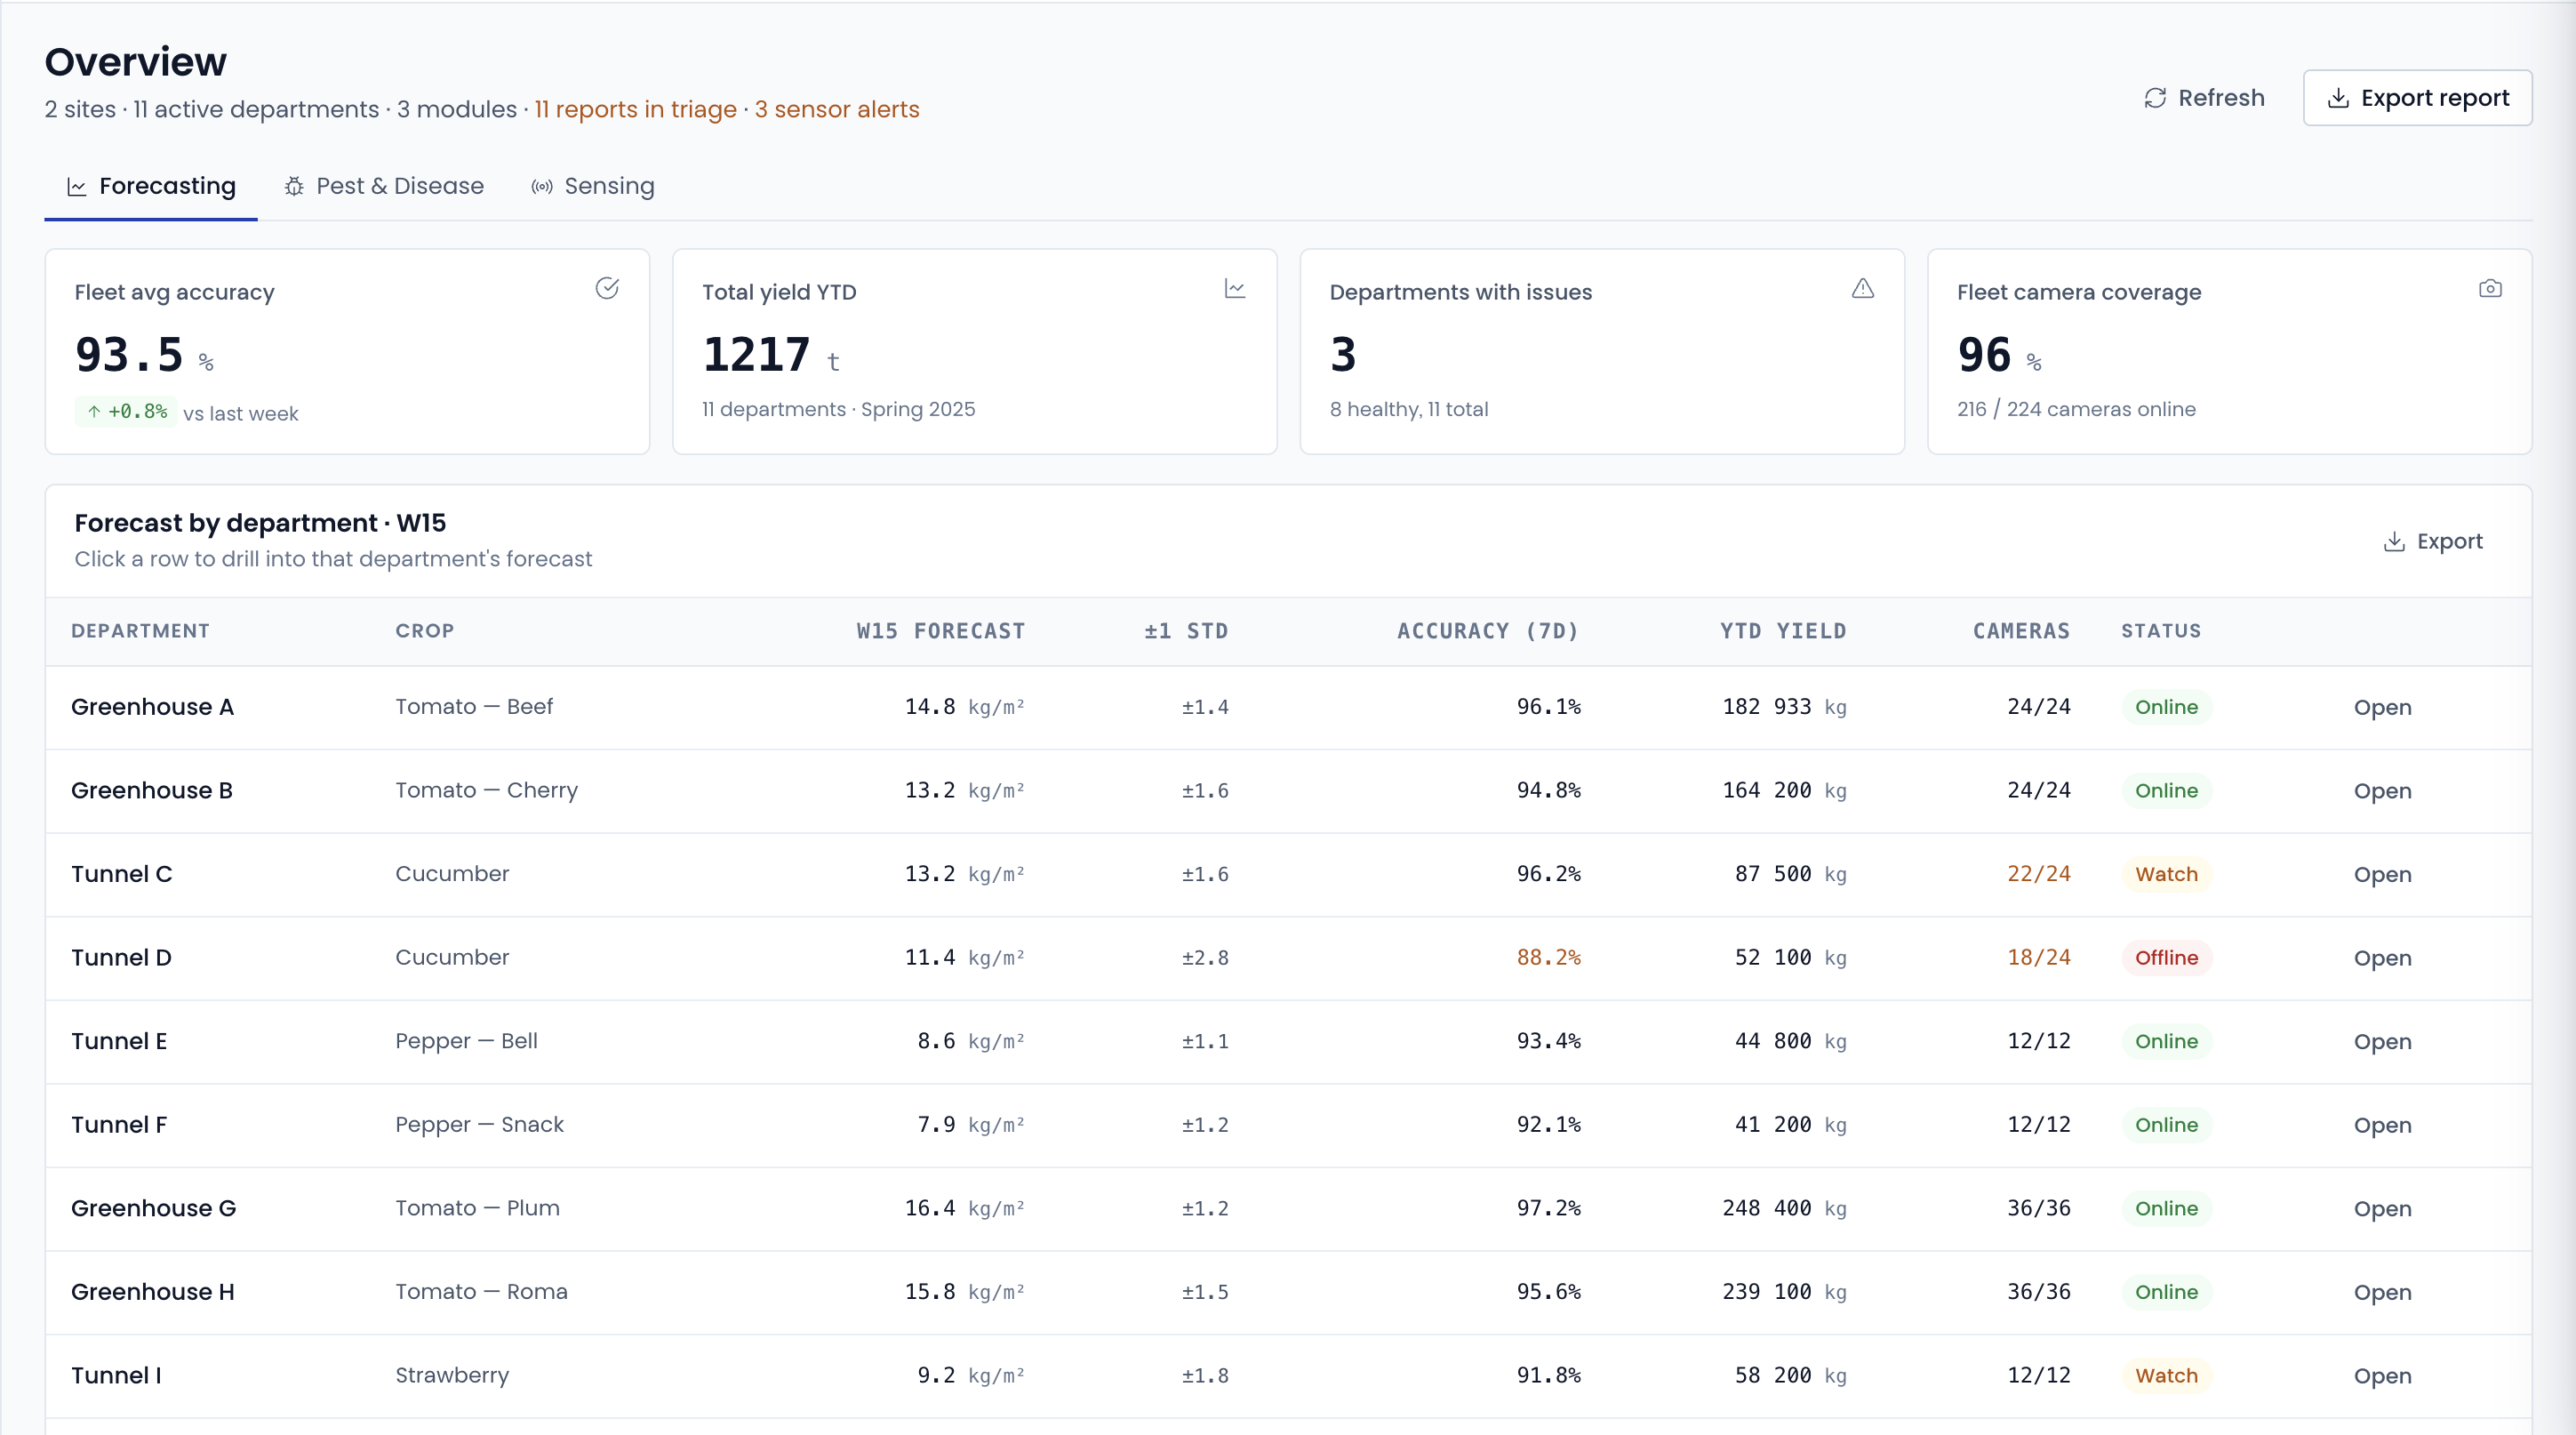
Sales View
For sales teams and cooperatives: a roll-up view showing aggregated forecast across locations, with breakdowns per grower, per crop, and per week.
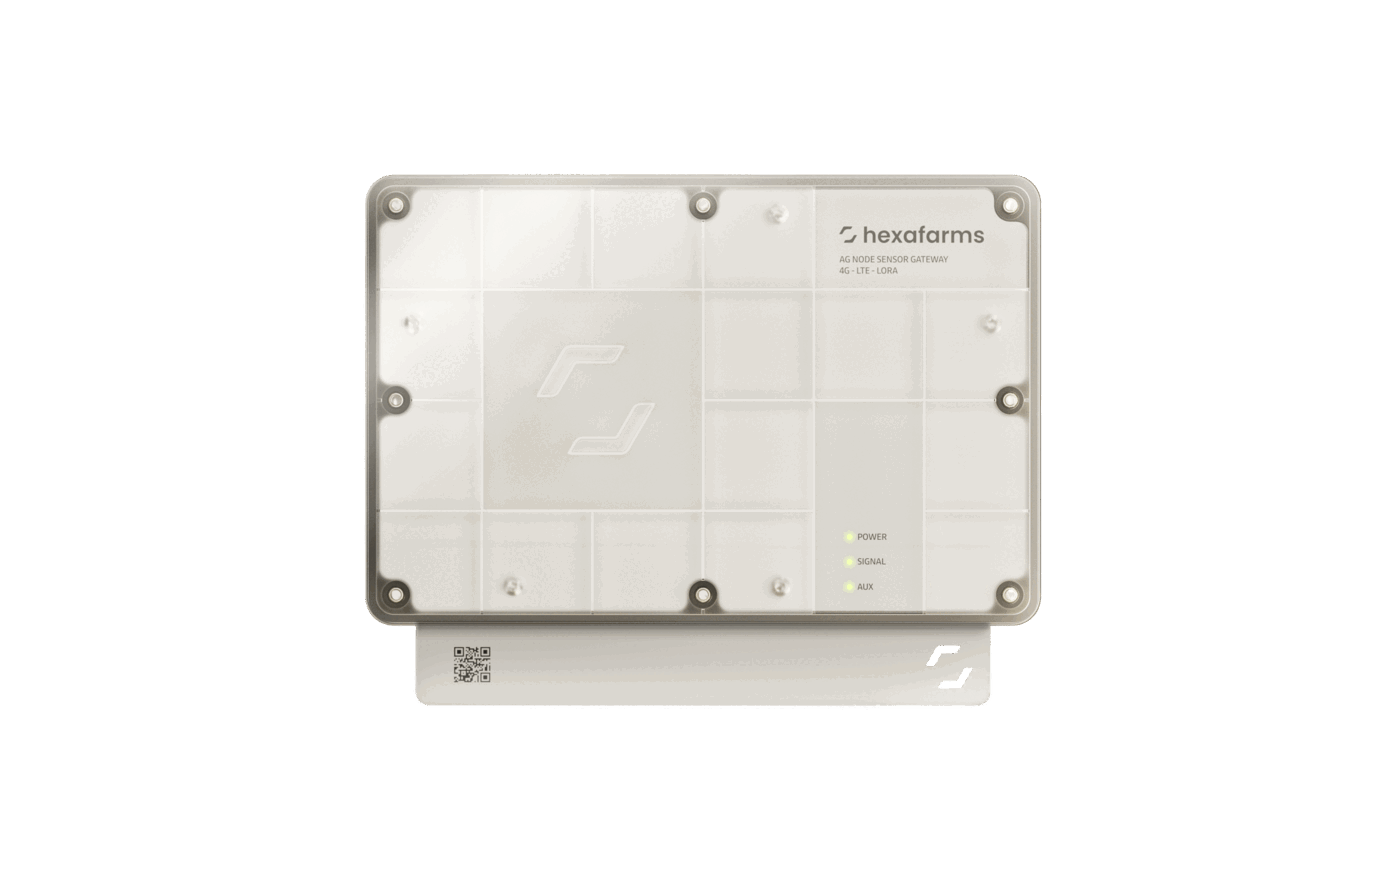
World-class systems require the highest data quality.
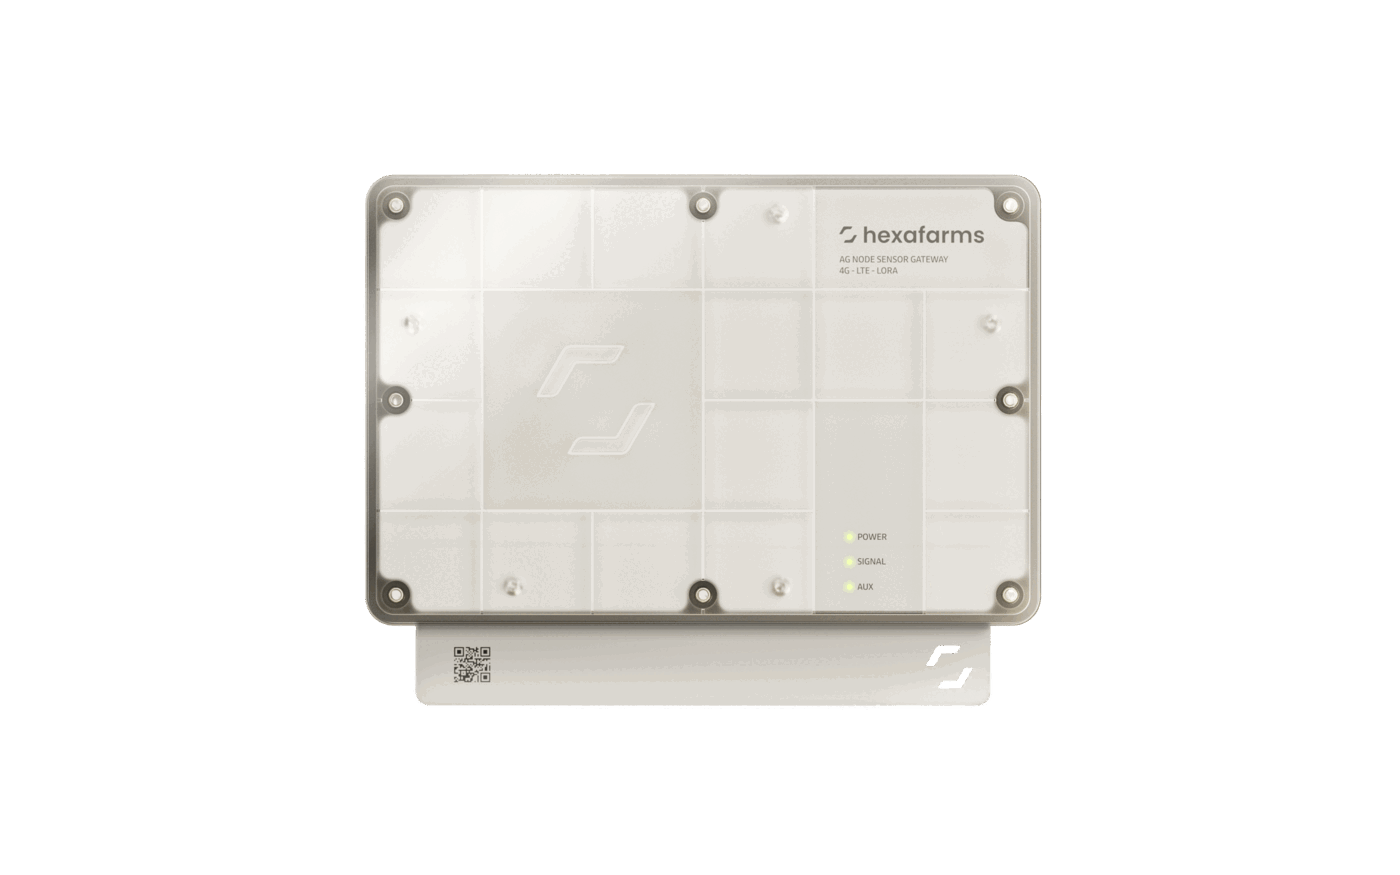
Without the Insight Stations and the AgNodes feeding the system, the forecast degrades to exactly what every other vendor offers: a historical average dressed up as precision.
Solar-powered cameras
Solar-powered climate sensors
Agronomical climate & plant analysis
The three principles that make this possible
↳ Probabilistic forecasting
Farm-specific training
Biology-driven models
The three principles that make this possible
Probabilistic, not point-estimate
Reliable ranges, not historical averages.
Traditional models offer a single static number, leaving you with zero safety buffer. We provide a forecast combined with a mathematically valid confidence band.
Smart limits:
Instead of predicting an exact 50 tons, we give you a secure range (e.g., between 48 and 52 tons).
Commercial freedom:
Commit to the lower bound (48 tons) with confidence, and safely negotiate trade on the upper potential.
Continuous tightening:
As your data builds, our forecast tightens by up to 30%.
Trained on your plants, not on averages
Tailored to your operation, not industry generalities.
Industry averages and past season yield-curves are just raw inputs, not final outputs. Our AI models learn directly from your unique operation.
Hyper-local validation:
The AI trains on your historical data and validates it live against your current season setup.
Absolute specificity:
Every calculation adapts dynamically to your operation, your exact crop variety, climate strategy, and harvesting decisions.
Climate adaptability:
Unpredictable anomalies like a heat wave won't break the model, they simply feed it more real-time data to improve the output.
Built on plant physiology, not simple climate data
Deep crop physiology breakdowns, optimising for your crop and your strategy.
Standard tools rely on historical averages, meaning any change in your operation will result in poor performance. hexafarms operates in a completely different scientific category.
80+ Live parameters:
We track actual fruit and flower counts, crop biomarkers, and precise microclimate conditions.
Dynamic growth tracking:
The model continuously factors in the microclimate history and the exact biological growth stage of the plant.
True physiology:
Your forecast is derived directly from real crop behavior, rather than approximated from historical averages.
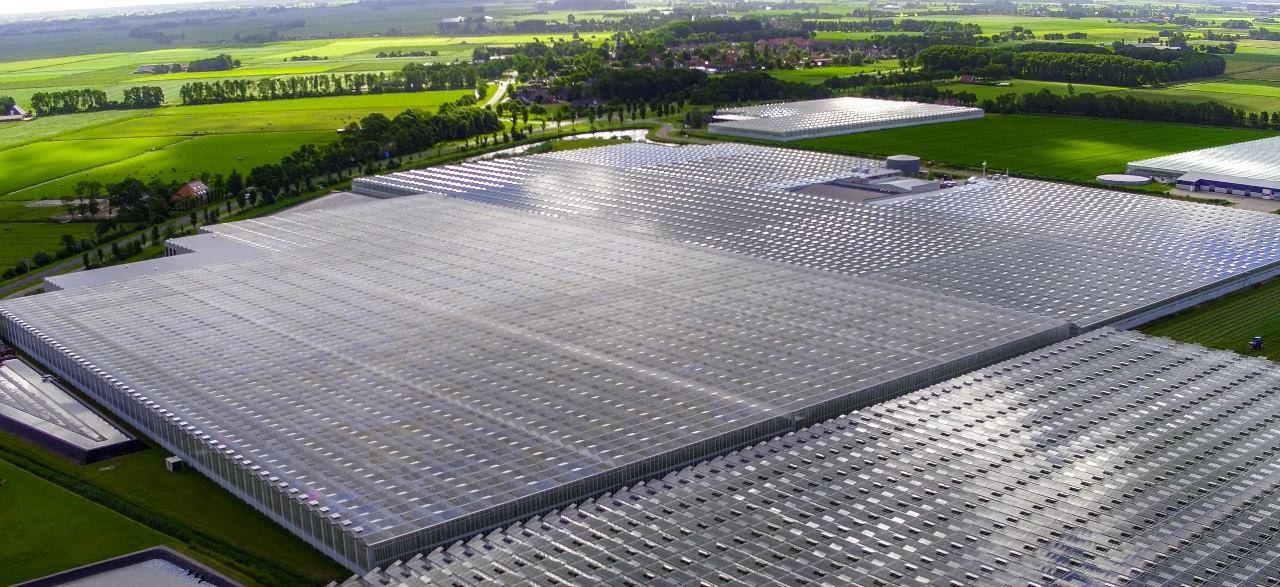
Case Study
Full Case Study
Tomato
Netherlands
“Instead of all those movable cameras or snapshots, this system takes continuous photos of the same location. That idea made sense to me straight away”
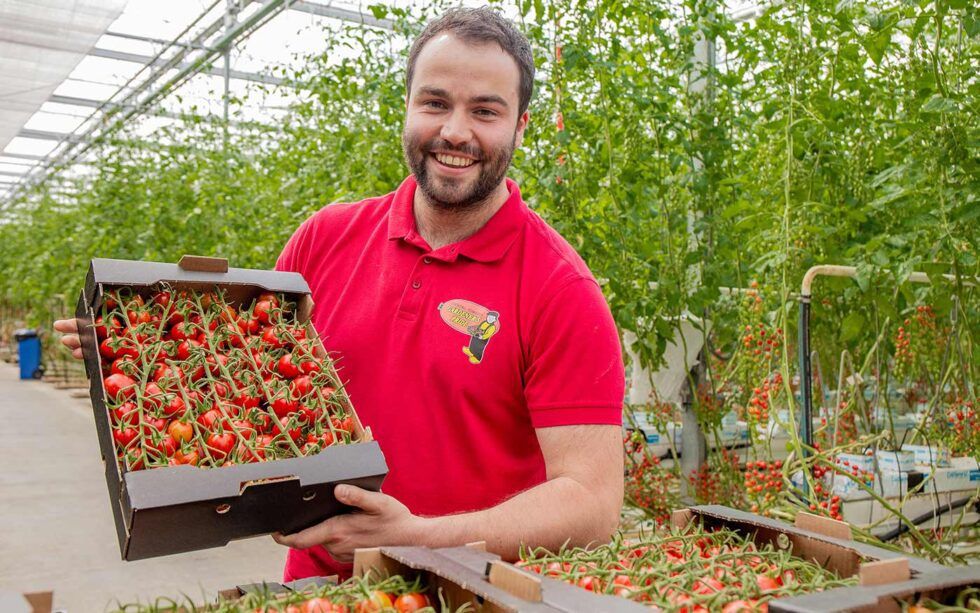
Marco van Overbeek
Managing Director
The situation:
Gardener's Pride is a family-run company in Friesland, the Netherlands, growing tomatoes, cucumbers, and strawberries. As they supply commercial buyers, the one-to-three week forecast window is critical for staffing, logistics, and sales commitments. This was the hardest to get right for their team. As Marco van Overbeek puts it: "If you're more than 10% off with a week to go, your buyer simply can't do anything with it anymore." Large swings in projected yield created ripple effects: buyers couldn't plan, the team couldn't plan, and every deviation chipped away at the trust that long-term partnerships depend on.
The choice:
Gardener's Pride chose hexafarms for two reasons: the approach and the organisation. Rather than movable cameras or periodic snapshots, hexafarms uses fixed cameras that continuously photograph the same greenhouse sections from the same vantage point. This builds a true picture of how each section develops week after week. The speed and flexibility with which hexafarms develops as a company was also a deciding factor.

The outcome:
Weekly forecasts consistently land within the 10% margin Marco set as the internal target, this is the threshold below which buyers can actually use the numbers to plan. At four weeks out, the large outliers that once created chaos downstream have effectively disappeared. Planning around harvest peaks, staffing, and logistics now happens with a level of confidence that wasn't possible before, and forecast reliability has strengthened relationships with sales partners.
The ROI
5x
Preventing one bad forecast already pays for the cost of an entire season
What you get:
- Forecast accuracy: 85–90%
- ROI for growers: 4–10×
- Up to 30% variance reduction versus statistical methods
- No upfront investment required
- Accurate from month one. Continues improving as data builds.
"hexafarms allows us to proactively sell our growers' produce, ensuring a better price over the entire season and more revenue for our growers."
Ricky Gommans
Business Analyst, ZON
Growers who already run hexafarms AgNodes do not pay twice for climate data. The sensor foundation is already in place, forecasting extends it. For growers starting with Forecasting, a sensing setup is included in the price.
The growers with the best forecasts are the ones with the best bottom lines.
Most growers start with Yield Forecasting as their first module, it solves the most visible commercial problem immediately. The data builds. The forecast improves. The other modules come later, on a foundation that is already working. Every module that is added improves the forecasting performance.