Option 01
Spreadsheets and grower intuition
Weekly estimates from experienced growers, combined into a single number for the sales team. Fast to run, zero setup cost, and often surprisingly close in operations where one senior grower has done the same variety for many years. The problem arrives when that grower is not in the building, when the variety changes, or when the supermarket needs a number that holds up to scrutiny.
Works well if
-
Volume is small and forecast misses are affordable
-
One senior grower with long variety history is always available
-
You are not supplying supermarkets on weekly volume contracts
Option 02
Standalone forecasting platforms
Dedicated yield forecasting tools that connect to your climate computer via API and produce a rolling harvest prediction. More structured than spreadsheets. Most are built on Growing Degree Days or industry-average yield curves, which means the model knows what temperature was, but not what your specific plants did last Tuesday. Reports a single number. Does not tell you how much to trust it.
Works well if
-
Close enough is good enough for your buyer commitments
-
Your operation is standard enough that industry averages hold
-
You do not need sensing or pest detection integrated
Option 03
hexafarms Yield Forecasting
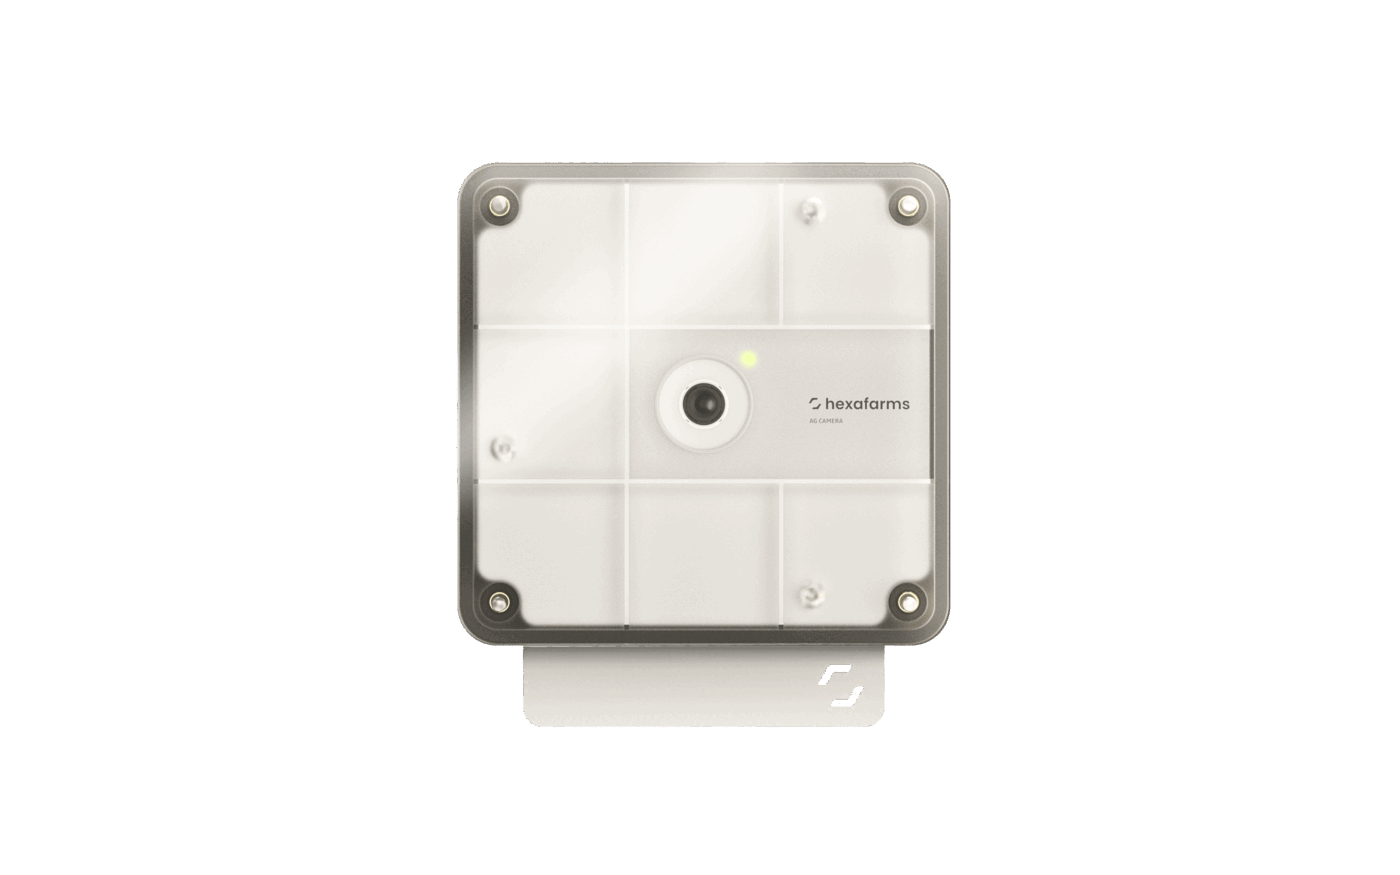
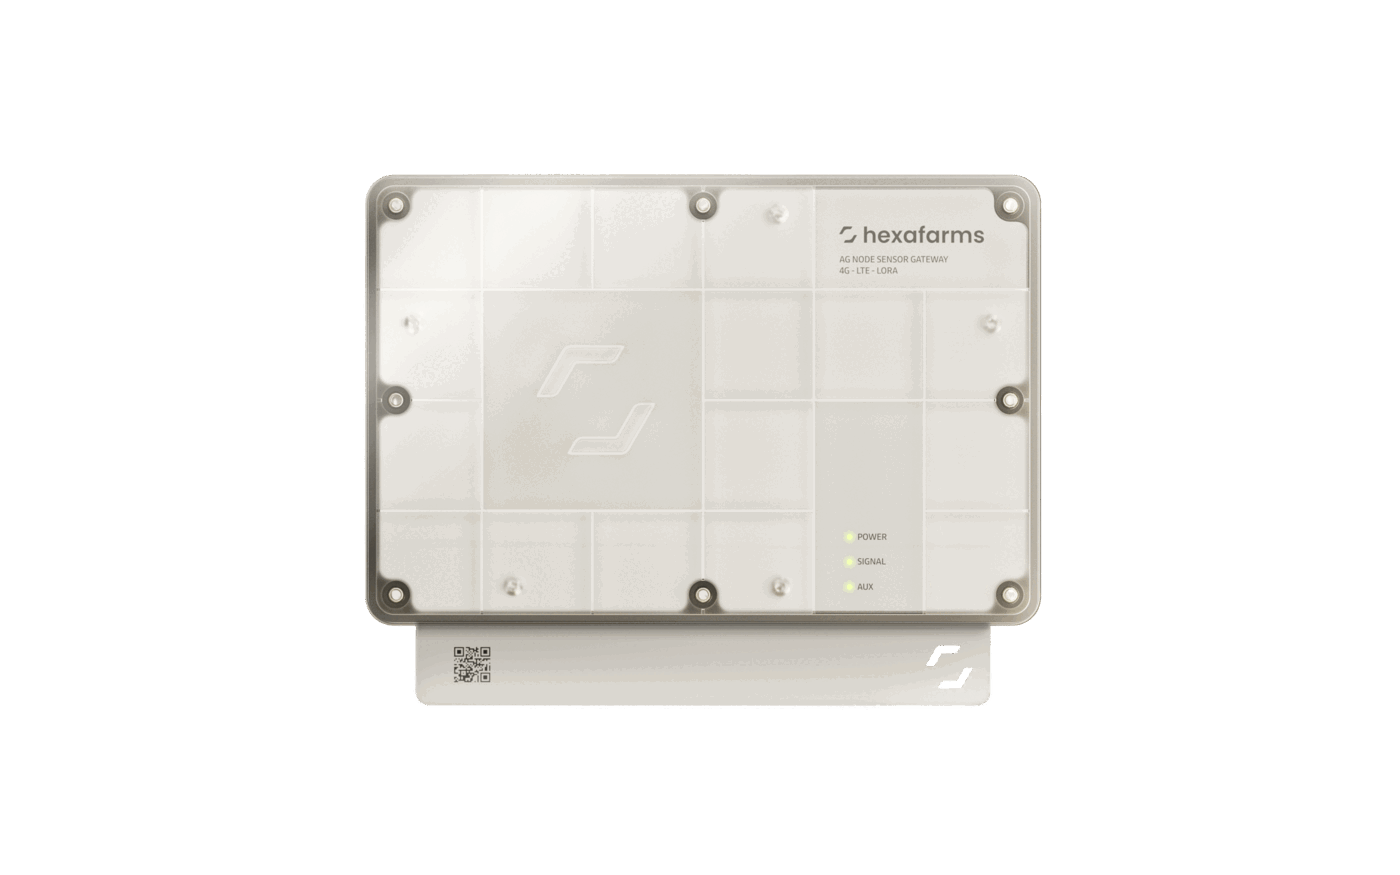
Part of the hexafarms OS, built on your sensing data
Trained on your plants, your variety, your growing history, not on industry averages. Reports a mean and a standard deviation, not a single number, so you know what to expect and how much to trust the expectation. Up to 30% variance reduction versus GDD-based methods. When you ask how accurate the forecast is, the technically correct answer is 100%: your actual harvest will always fall within one standard deviation of the forecast band. That is what makes it a number you can commit to.
Works well if
-
You supply supermarkets on weekly volume contracts
-
Labour planning, logistics, and pricing depend on forecast precision
-
You want a forecast that gets sharper as your data builds